There are two types of reports available for native JoomLMS quizzes, that provide detailed information on quiz attempts, users' answers to quiz questions, and graphical representation for the answers selection. The Quiz reports can be accessed in multiple different ways, depending on the type of the report.
Quizzes Report
You can access the detailed report on all quiz attempts taken by all students of a course in the following way:
- In the Quizzes section of a course, in the Quizzes tab, click the Reports button and select Reports from the drop-down menu.
- In the Quizzes section of a course go to the Reports tab.
- In the Tracking section of a course click the Quizzes Report button on the right.
The Quizzes report lists all the quiz attempts for all the quizzes in the course taken by all the course Students.
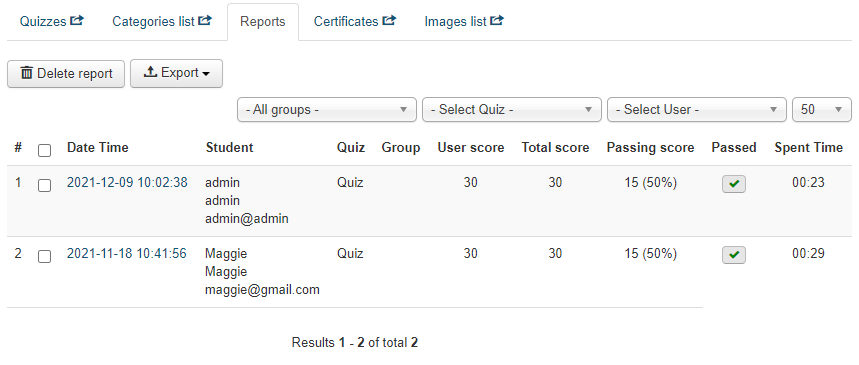
The default report layout includes the following parameters for each quiz attempt: the date and time when the attempt was started, name, username and email of the user who took the quiz, name of the quiz, the group to which the user belongs (if any), user score (the number of points the Student received for the correct answers), total score (the maximum number of points a Student could receive if they answered all the questions in this quiz correctly), passing score (the percentage of correct answers and number of points for the correct answers a Student should receive in order for the quiz to be marked as 'passed'), attempt status (green checkmark if the quiz is passed, red X mark if the quiz is failed or if the attempt was not completed), time spent on the attempt.
You can filter the report by group, quiz, and/or by user using the drop-down filters at the top of the page.
To export the report click the Export button at the top of the list and select the format for the report from the drop-down menu. The CSV format allows to export multiple attempts completed by multiple users (check the boxes for the selected multiple attempts that should be included in the exported version or don't check any boxes at all to export all the available attempts). The XLS format allows to export multiple attempts completed by only one user at a time (select the required user in the filter at the top of the list before clicking the Export button).
Quiz attempt details
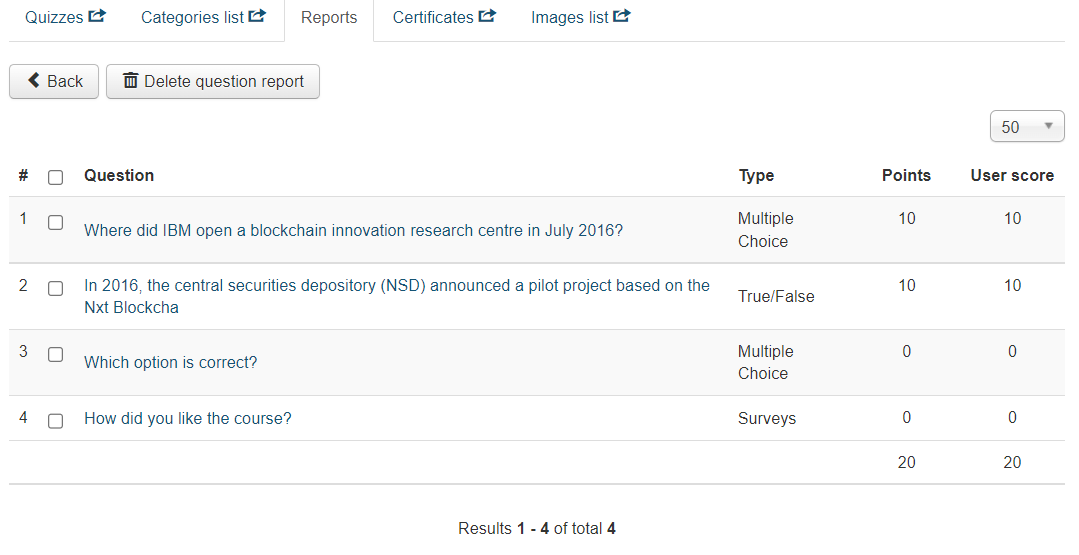
To access the detailed information about one particular Quiz attempt, click on the date and time of the respective attempt in the Quizzes report. You will be redirected to the online report on this attempt that includes the following information: the list of all the questions that either belong to the Quiz that was taken or were drawn from the Question Pool/Global Question Pool for that specific attempt with the type of the question, points (the number of points that user can get for the correct answer for that question) and user score (the number of points the user actually received after answering the question) specified for each question.
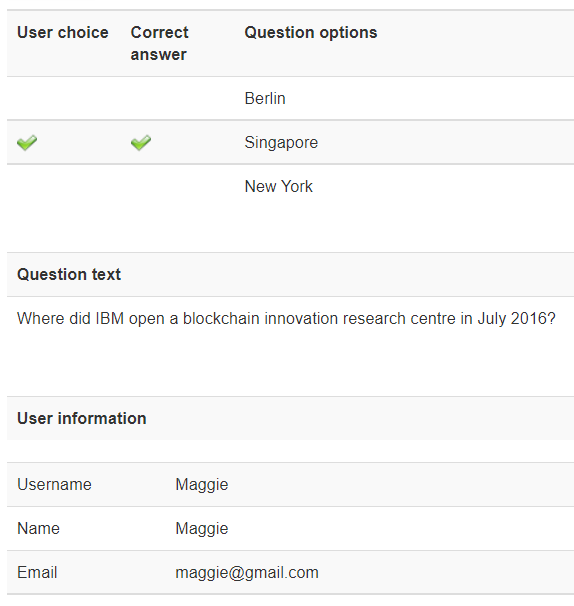
To access the detailed information about one particular question in the attempt, click on the respective question. You will be redirected to an online report on this question that includes the following: the list of the question answer options, the correct answer option and the answer option that the user selected, question text, and the username, name and email of the user who answered the question.
The report on one particular question can be deleted using the Delete question report button at the top of the quiz attempt report page but you can't export it separately.
Quiz answers statistics
You can view the graphical representation on the percentage of various answer options selected by users. You can access graphical statistics in the following way:
- In the Quizzes section of a course, in the Quizzes tab, click the Reports button and select View Quizzes statistics from the drop-down menu.
- In the Tracking section of a course click the Quiz answers statistics button on the right.
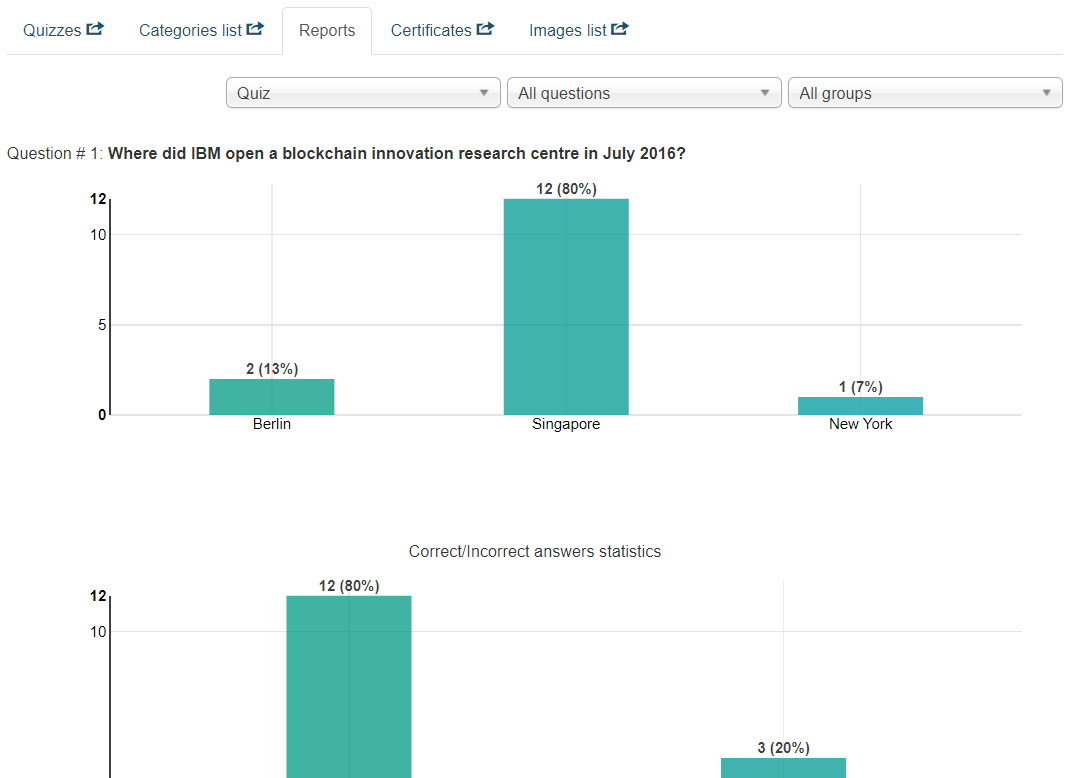
The graphical report includes the following details:
- The number of times users selected each answer option of a particular question.
- The number of times users selected the correct and incorrect answer options.
You can filter the graphical statistics report by quiz, question category, and usergroup using the drop-down filters at the top of the page. This report is available only online and can't be exported.