Quiz Reports
- Category: Reports
There are two types of reports available for native JoomLMS quizzes, that provide detailed information on quiz attempts, users' answers to quiz questions, and graphical representation for the answers selection. The Quiz reports can be accessed in multiple different ways, depending on the type of the report.
Quizzes Report
You can access the detailed report on all quiz attempts taken by all students of a course in the following way:
- In the Quizzes section of a course, in the Quizzes tab, click the Reports button and select Reports from the drop-down menu.
- In the Quizzes section of a course go to the Reports tab.
- In the Tracking section of a course click the Quizzes Report button on the right.
The Quizzes report lists all the quiz attempts for all the quizzes in the course taken by all the course Students.
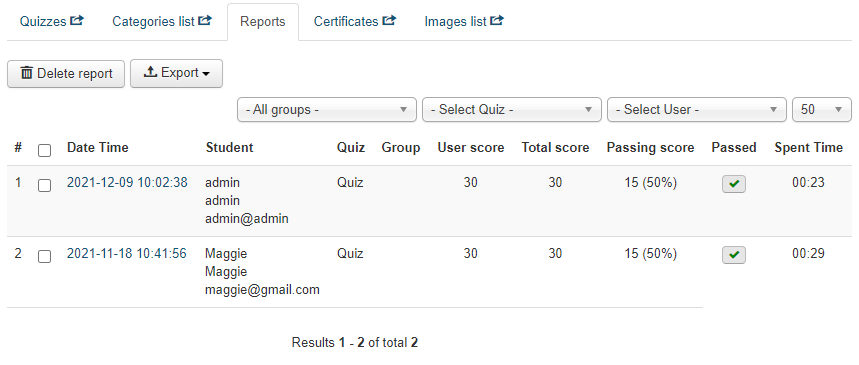
The default report layout includes the following parameters for each quiz attempt: the date and time when the attempt was started, name, username and email of the user who took the quiz, name of the quiz, the group to which the user belongs (if any), user score (the number of points the Student received for the correct answers), total score (the maximum number of points a Student could receive if they answered all the questions in this quiz correctly), passing score (the percentage of correct answers and number of points for the correct answers a Student should receive in order for the quiz to be marked as 'passed'), attempt status (green checkmark if the quiz is passed, red X mark if the quiz is failed or if the attempt was not completed), time spent on the attempt.
You can filter the report by group, quiz, and/or by user using the drop-down filters at the top of the page.
To export the report click the Export button at the top of the list and select the format for the report from the drop-down menu. The CSV format allows to export multiple attempts completed by multiple users (check the boxes for the selected multiple attempts that should be included in the exported version or don't check any boxes at all to export all the available attempts). The XLS format allows to export multiple attempts completed by only one user at a time (select the required user in the filter at the top of the list before clicking the Export button).
Quiz attempt details
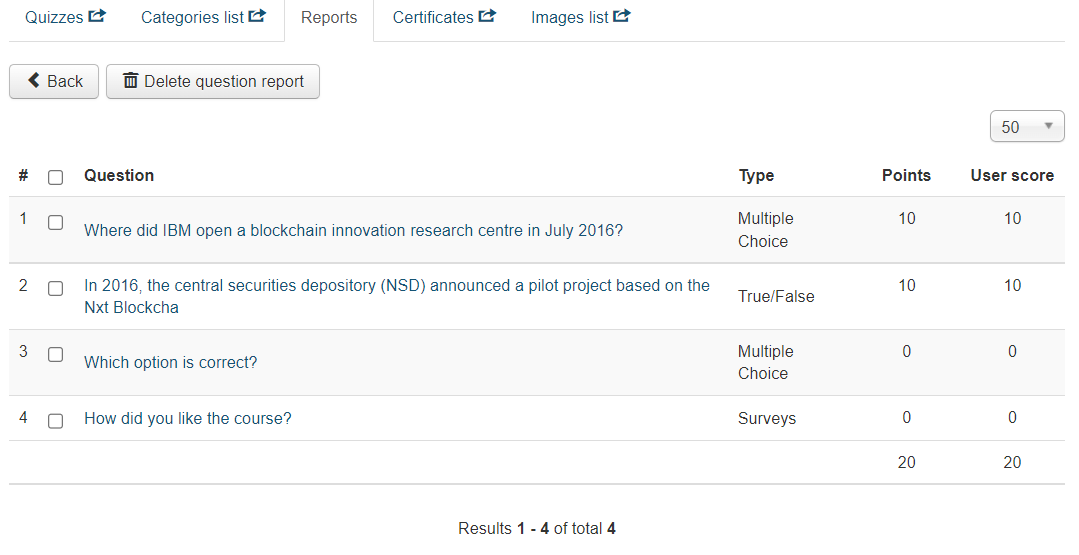
To access the detailed information about one particular Quiz attempt, click on the date and time of the respective attempt in the Quizzes report. You will be redirected to the online report on this attempt that includes the following information: the list of all the questions that either belong to the Quiz that was taken or were drawn from the Question Pool/Global Question Pool for that specific attempt with the type of the question, points (the number of points that user can get for the correct answer for that question) and user score (the number of points the user actually received after answering the question) specified for each question.
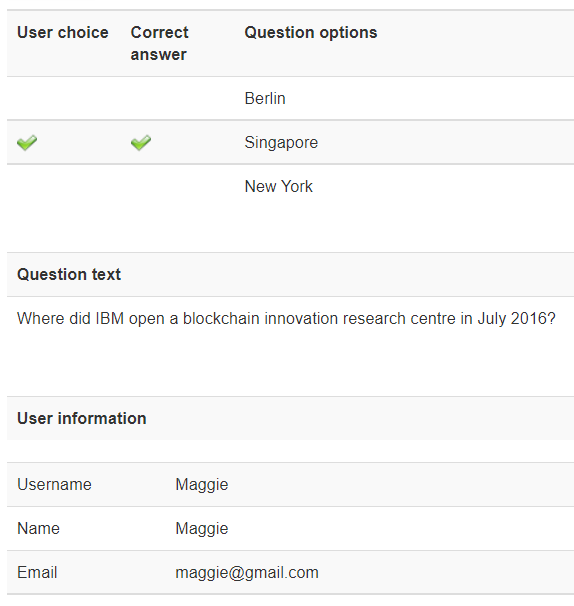
To access the detailed information about one particular question in the attempt, click on the respective question. You will be redirected to an online report on this question that includes the following: the list of the question answer options, the correct answer option and the answer option that the user selected, question text, and the username, name and email of the user who answered the question.
The report on one particular question can be deleted using the Delete question report button at the top of the quiz attempt report page but you can't export it separately.
Quiz answers statistics
You can view the graphical representation on the percentage of various answer options selected by users. You can access graphical statistics in the following way:
- In the Quizzes section of a course, in the Quizzes tab, click the Reports button and select View Quizzes statistics from the drop-down menu.
- In the Tracking section of a course click the Quiz answers statistics button on the right.
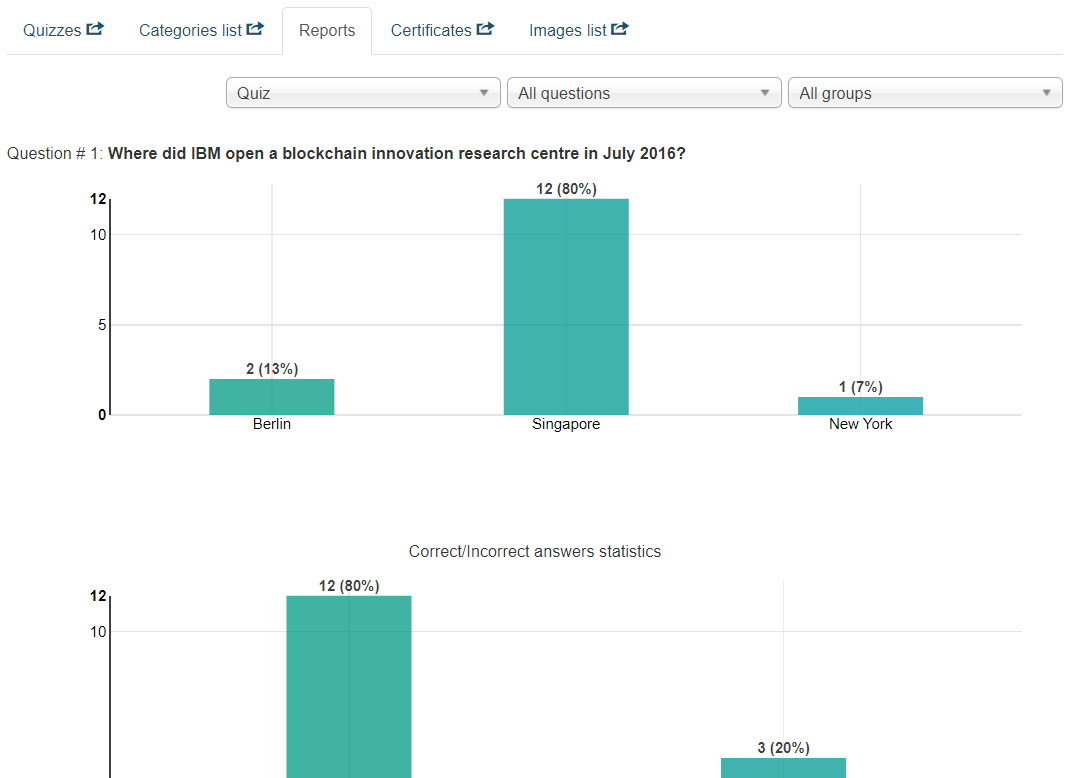
The graphical report includes the following details:
- The number of times users selected each answer option of a particular question.
- The number of times users selected the correct and incorrect answer options.
You can filter the graphical statistics report by quiz, question category, and usergroup using the drop-down filters at the top of the page. This report is available only online and can't be exported.
Gradebook
- Category: Reports
In the Gradebook section of the course, you can assess Students’ activity in various aspects of the learning process. By default, the Gradebook reports display grades for various existing course elements (Quizzes, SCORMs) and the course completion status, but you can also create custom Gradebook items and manually grade them using a custom scale, which you can configure differently in each course. The Gradebook section also allows you to configure course certificates and automatic course completion criteria.
Gradebook reports
To access the Gradebook reports, enter the Gradebook section of the course. There are two reports available:
- The report with the grades for all the Students of the course.
You can see the complete list of course Students and their grades directly in the Gradebook tab when you enter the Gradebook section of the course. For each Student you can see the following information in this report: name, group, course enrollment time, answer to the course registration question (if any), course completion status, and all the existing grades in respective columns for each graded item.
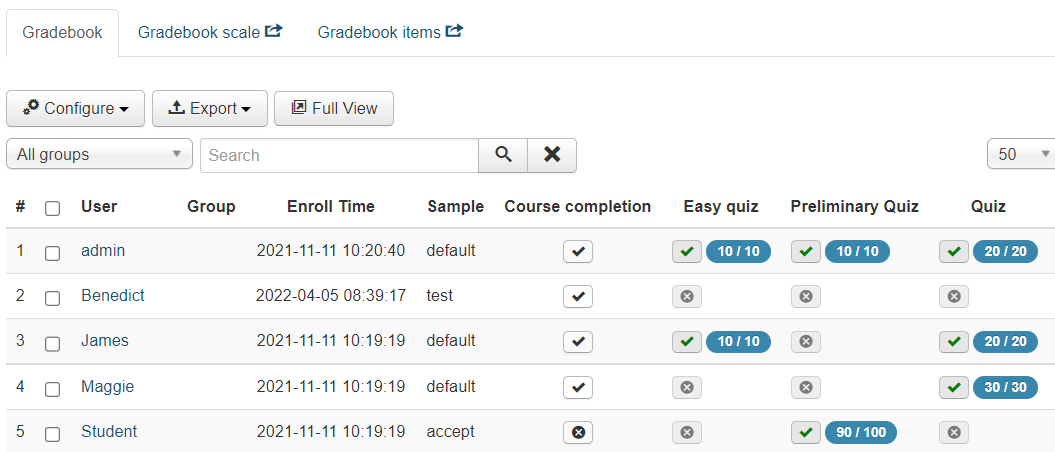
The Gradebook report for the Students of the course can be filtered by group and exported in XLS/CSV formats by clicking the Export button at the top of the page. The Full View button allows to open the report in a new tab.
- The report with the grades for each individual Student.
To access the grades of a specific Student, click the name of the Student in the list in the Gradebook tab. You will be redirected to a page with detailed information about the Student (name, username, email, group), course completion status and details and course certificate download button, existing grades for quizzes and SCORMs with the options to export detailed quiz results next to each quiz grade, course registration question answer with the option to edit the answer manually, and the custom Gradebook items with the drop-down menus that allow to manually grade them.
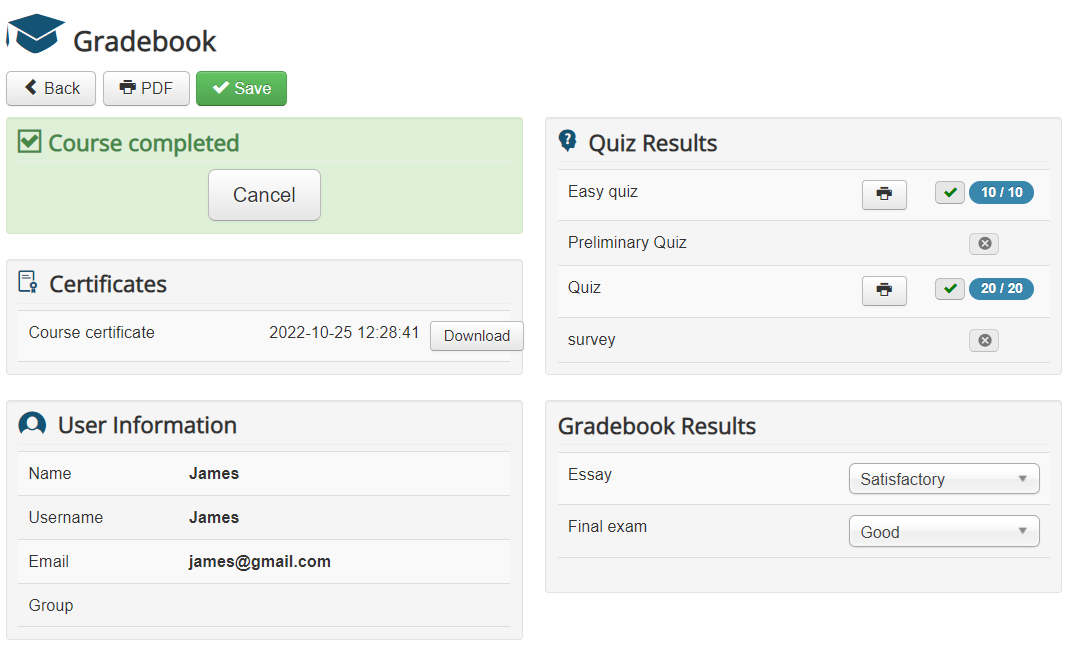
The individual Student report can be exported in the PDF format by clicking the PDF button at the top of the page.
Gradebook scale
You can create a custom scale of grades in each course. You can use the grades from the scale to grade custom Gradebook items and graded assignments.
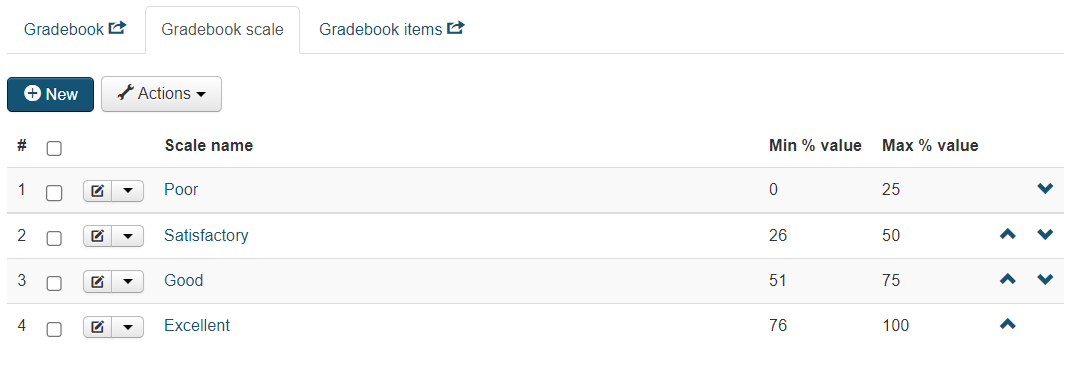
To create a scale of grades, follow these steps:
- In the Gradebook section of the course, click on the Gradebook scale tab at the top of the page.
- Click New to add a grade. The new grade configuration page will open.
- Configure the parameters for the new grade:
- Enter name: specify the name of the grade, e.g. 'Good', 'Satisfactory' etc.
- Min. % value: specify the lowest value (in percent) of the range that this grade covers .
- Max % value: specify the highest value (in percent) of the range that this grade covers.
 Note: You can create as many grades as you want but together they should cover the whole range from 0 to 100%, for example, you can create three grade items in your scale: 'Poor' (0% to 33%), 'Good' (34% to 66%) and 'Excellent' (67% to 100%).
 - Click Save to save the grade. You will see the new grade in the Gradebook scale.
You can assign grades manually only to the custom Gradebook items. Grades are automatically assigned to the native JoomLMS quizzes' scores according to the percent of the correct answers a user provided. To see the grade for a specific quiz result, hover the cursor over the respective element in the corresponding quiz column next to the Student whose grade you would like to check.
Gradebook items
If you need to include some grades into the Gradebook report (e.g. grades for some offline activity), you can create custom Gradebook items that are graded manually.
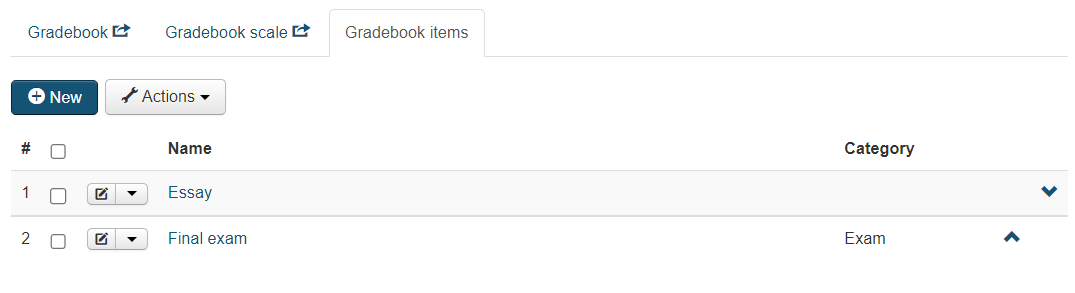
To add a custom Gradebook item:
- In the Gradebook section of the course, click on the Gradebook items tab at the top of the page.
- Click New to add a custom graded item. The new item configuration page will open.
- Configure the parameters for the new graded item:
- Enter name: specify the name of the graded item, e.g. 'Final exam'.
- Category: select the category of the graded item from the drop-down menu.
Note: You can edit the list of available categories in the administrator area, see Administrator documentation - Configuration - Gradebook.
- Description: enter the graded item's description, if any. The description will not be visible for Students.
- Click Save to save the graded item. You will see the new item as a separate column in the Gradebook section.
To mark a custom Gradebook item, click on the name of the Student who should receive the grade in the Gradebook section, select the grade from the drop-down menu next to the respective item and click Save at the top of the page.
Tracking
- Category: Reports
The system allows the Teacher to track different aspects of course statistics in the Tracking section. There are multiple reports available in this section; some reports are displayed directly at the Tracking page, others can be accessed via a set of buttons on the right side of the page. When you enter the Tracking section of the course, the following reports are available immediately in the Overview tab:
- Latest course activities (short version)
- Course access statistics: yearly/monthly, weekly and daily distribution
- Access to Tools
- Most active users
The reports accessible via respective separate buttons on the right are as follows:
- Documents downloads statistics
- Learning Paths statistics
- Latest course activities (full version)
- Quizzes report
- Quiz answers statistics
Latest course activities
This report displays the list of latest user activities in the course, for example when users start viewing certain course materials or enter certain course sections. You can see the time when the activity started in this report, so this allows you to approximately calculate the amount of time users spent on various activities.

You can see the short version of this report, with only 10 latest entries, directly at the Tracking page, to see the full version of the report (up to 500 latest activities), click the respective button on the right, under Statistics reports. The full version of the report can be filtered by group and/or user and exported in XLS or CSV format.
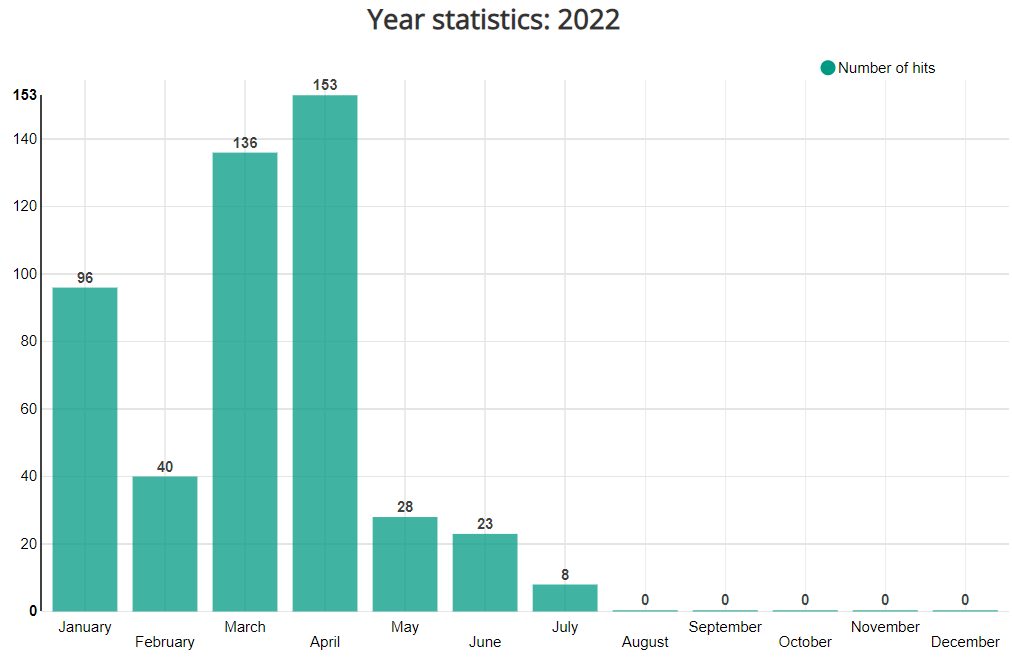
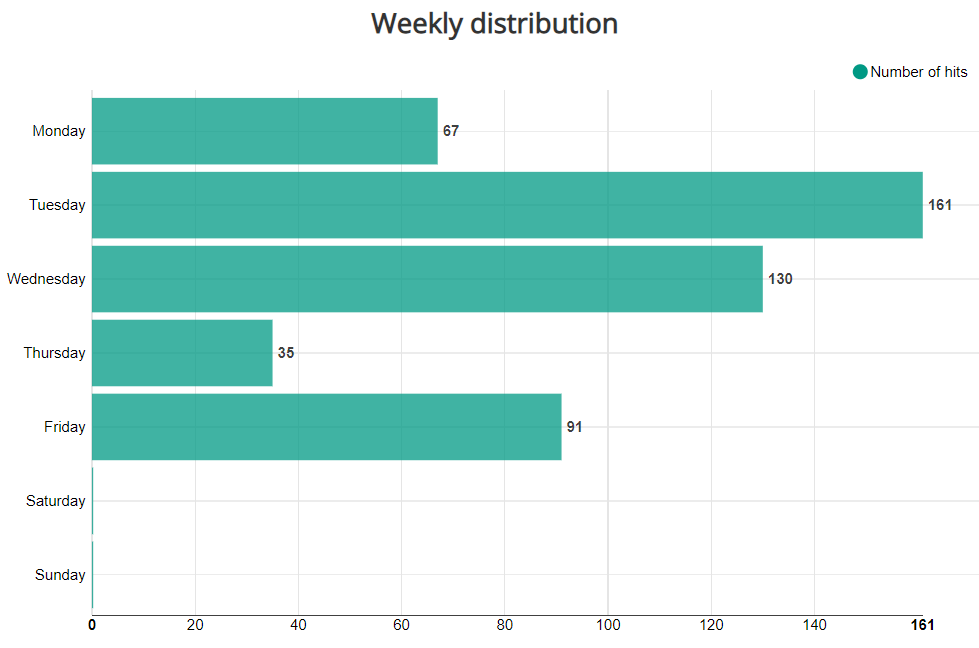
Course access statistics
This report is the graphical representation of the number of times users accessed the course. There are three tabs with different types of statistics distribution: by year/month, by day of the week and by hour of the day.
The yearly/monthly tab displays the number of times users accessed the course in each month of the selected year or on each day of the selected month. The current year is pre-selected by default, the filter above the tab allows to select a different year or a specific month of the year.
The weekly distribution tab displays the number of times users accessed the course on specific days of the week for the respective period of time selected in the yearly/monthly tab.
The daily distribution tab displays the number of times users accessed the course at specific hours of the day for the respective period of time selected in the yearly/monthly tab.
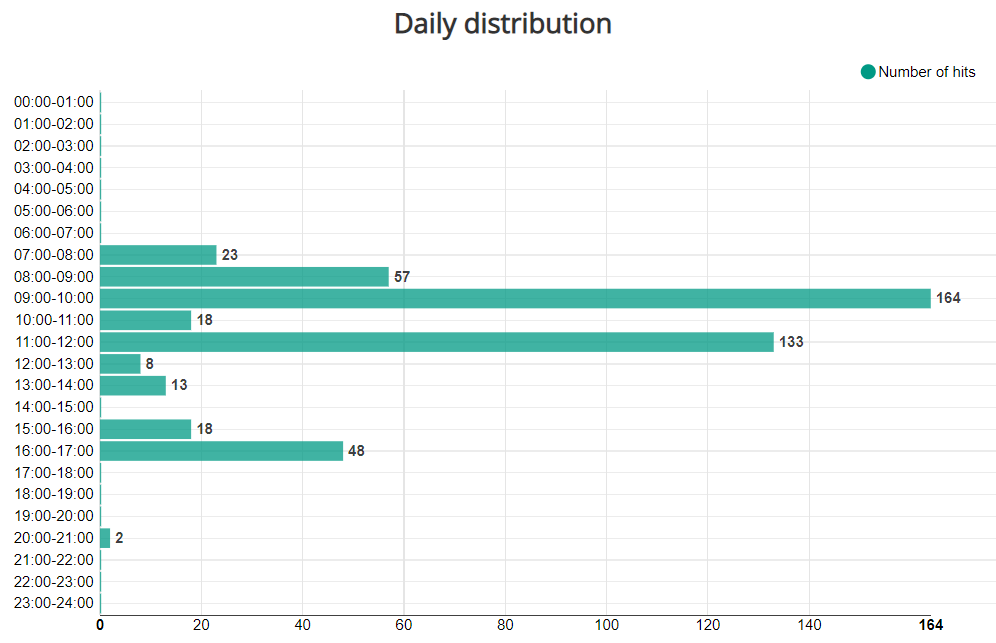
The weekly/daily distribution tab information allows you to determine on what days/time of the day most students attend the course. You can use this statistics, for example, to determine the best time for the Teacher to be present online in the course Chat to answer the Students' questions personally.
Access to Tools
This report is the graphical representation of the number of times users accessed every course section/tool. You can see the names of each presented course tool in the list on the right. When you hover the cursor over the respective element of the chart, besides the name of the course tool, you can also see the number of times users accessed it and what percentage of the total number of hits that makes.
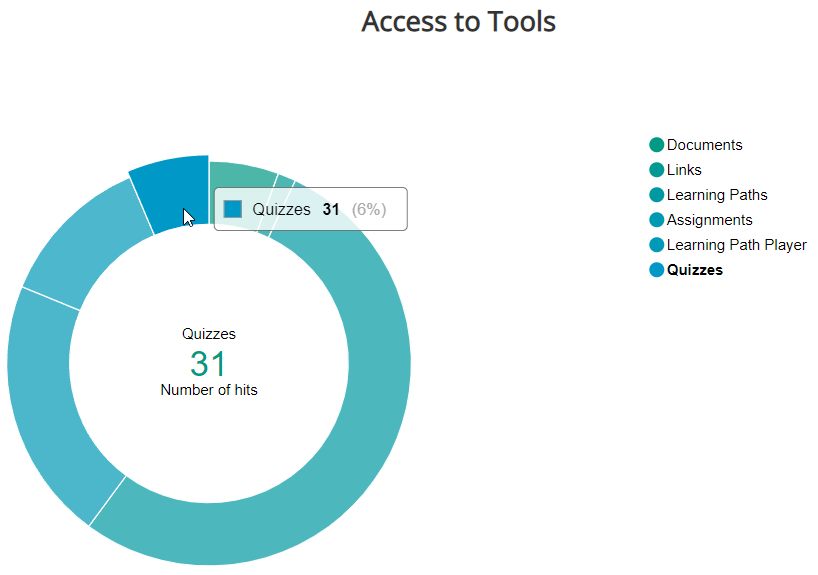
You can click on the names of the course sections in the list on the right to select/deselect them and respectively include certain sections in the report or exclude them from it.
Most active users
This report is the graphical representation of users' activity in the course; you can see the total number of times each user entered the course in this report. You can see the names of each user included in the report in the list on the right. When you hover the cursor over the respective element of the chart, besides the name of the user, you can also see the total number of times the user accessed the course and what percentage of the total number of hits by all users that makes.
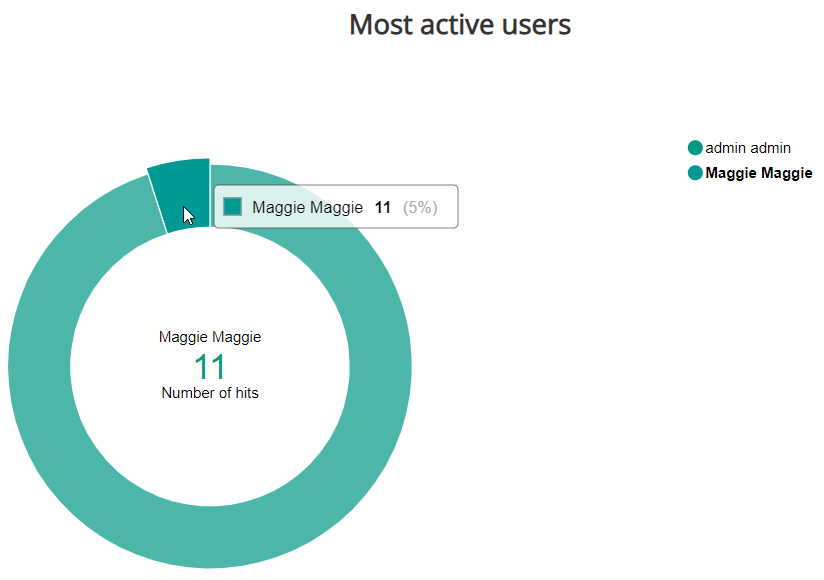
You can click on the names of the users in the list on the right to select/deselect them and respectively include certain users in the report or exclude them from it.
Documents downloads statistics
This report displays the list of all the documents available in the course with the number of times each document has been downloaded and the date and time of the latest download. You can also expand the details by clicking on the magnifying glass icon on the left from the respective document to see how many times each course Student downloaded the document.
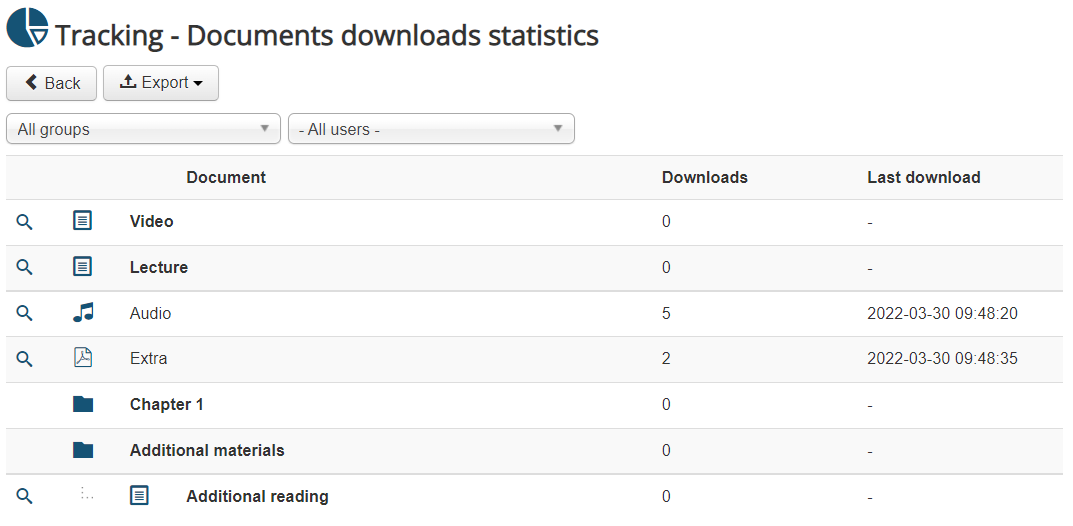
You can filter the report by user/group and export it in CSV/XLS format.
Learning Paths statistics
This report displays the list of all the SCORMs and Learning Paths in the course. When the list is filtered by user you can also see the completion percentage, the completion status, the number of points received (for SCORMs only), the number of the attempt, and the Start and End date and time of the attempt.
Note: The number of the attempt displayed changes (increases) only if the Grading method parameter of the course (Course settings > Step 2) is set as Last attempt. If Best attempt is selected for Grading method then then number of the attempt will always be displayed as 1.
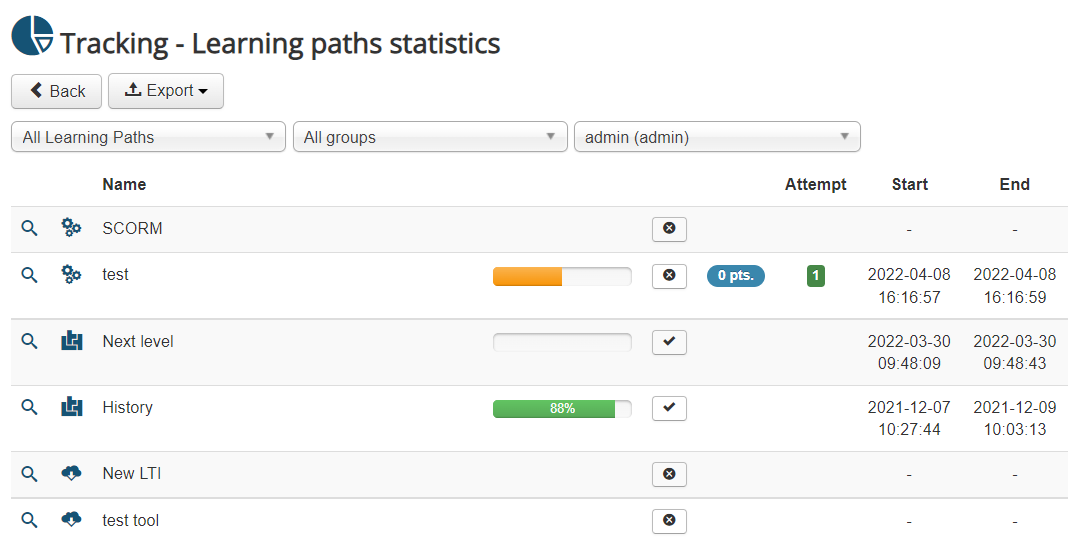
You can export the report in CSV/XLS format but only for one user at a time, so you need to filter the report by user before exporting it.